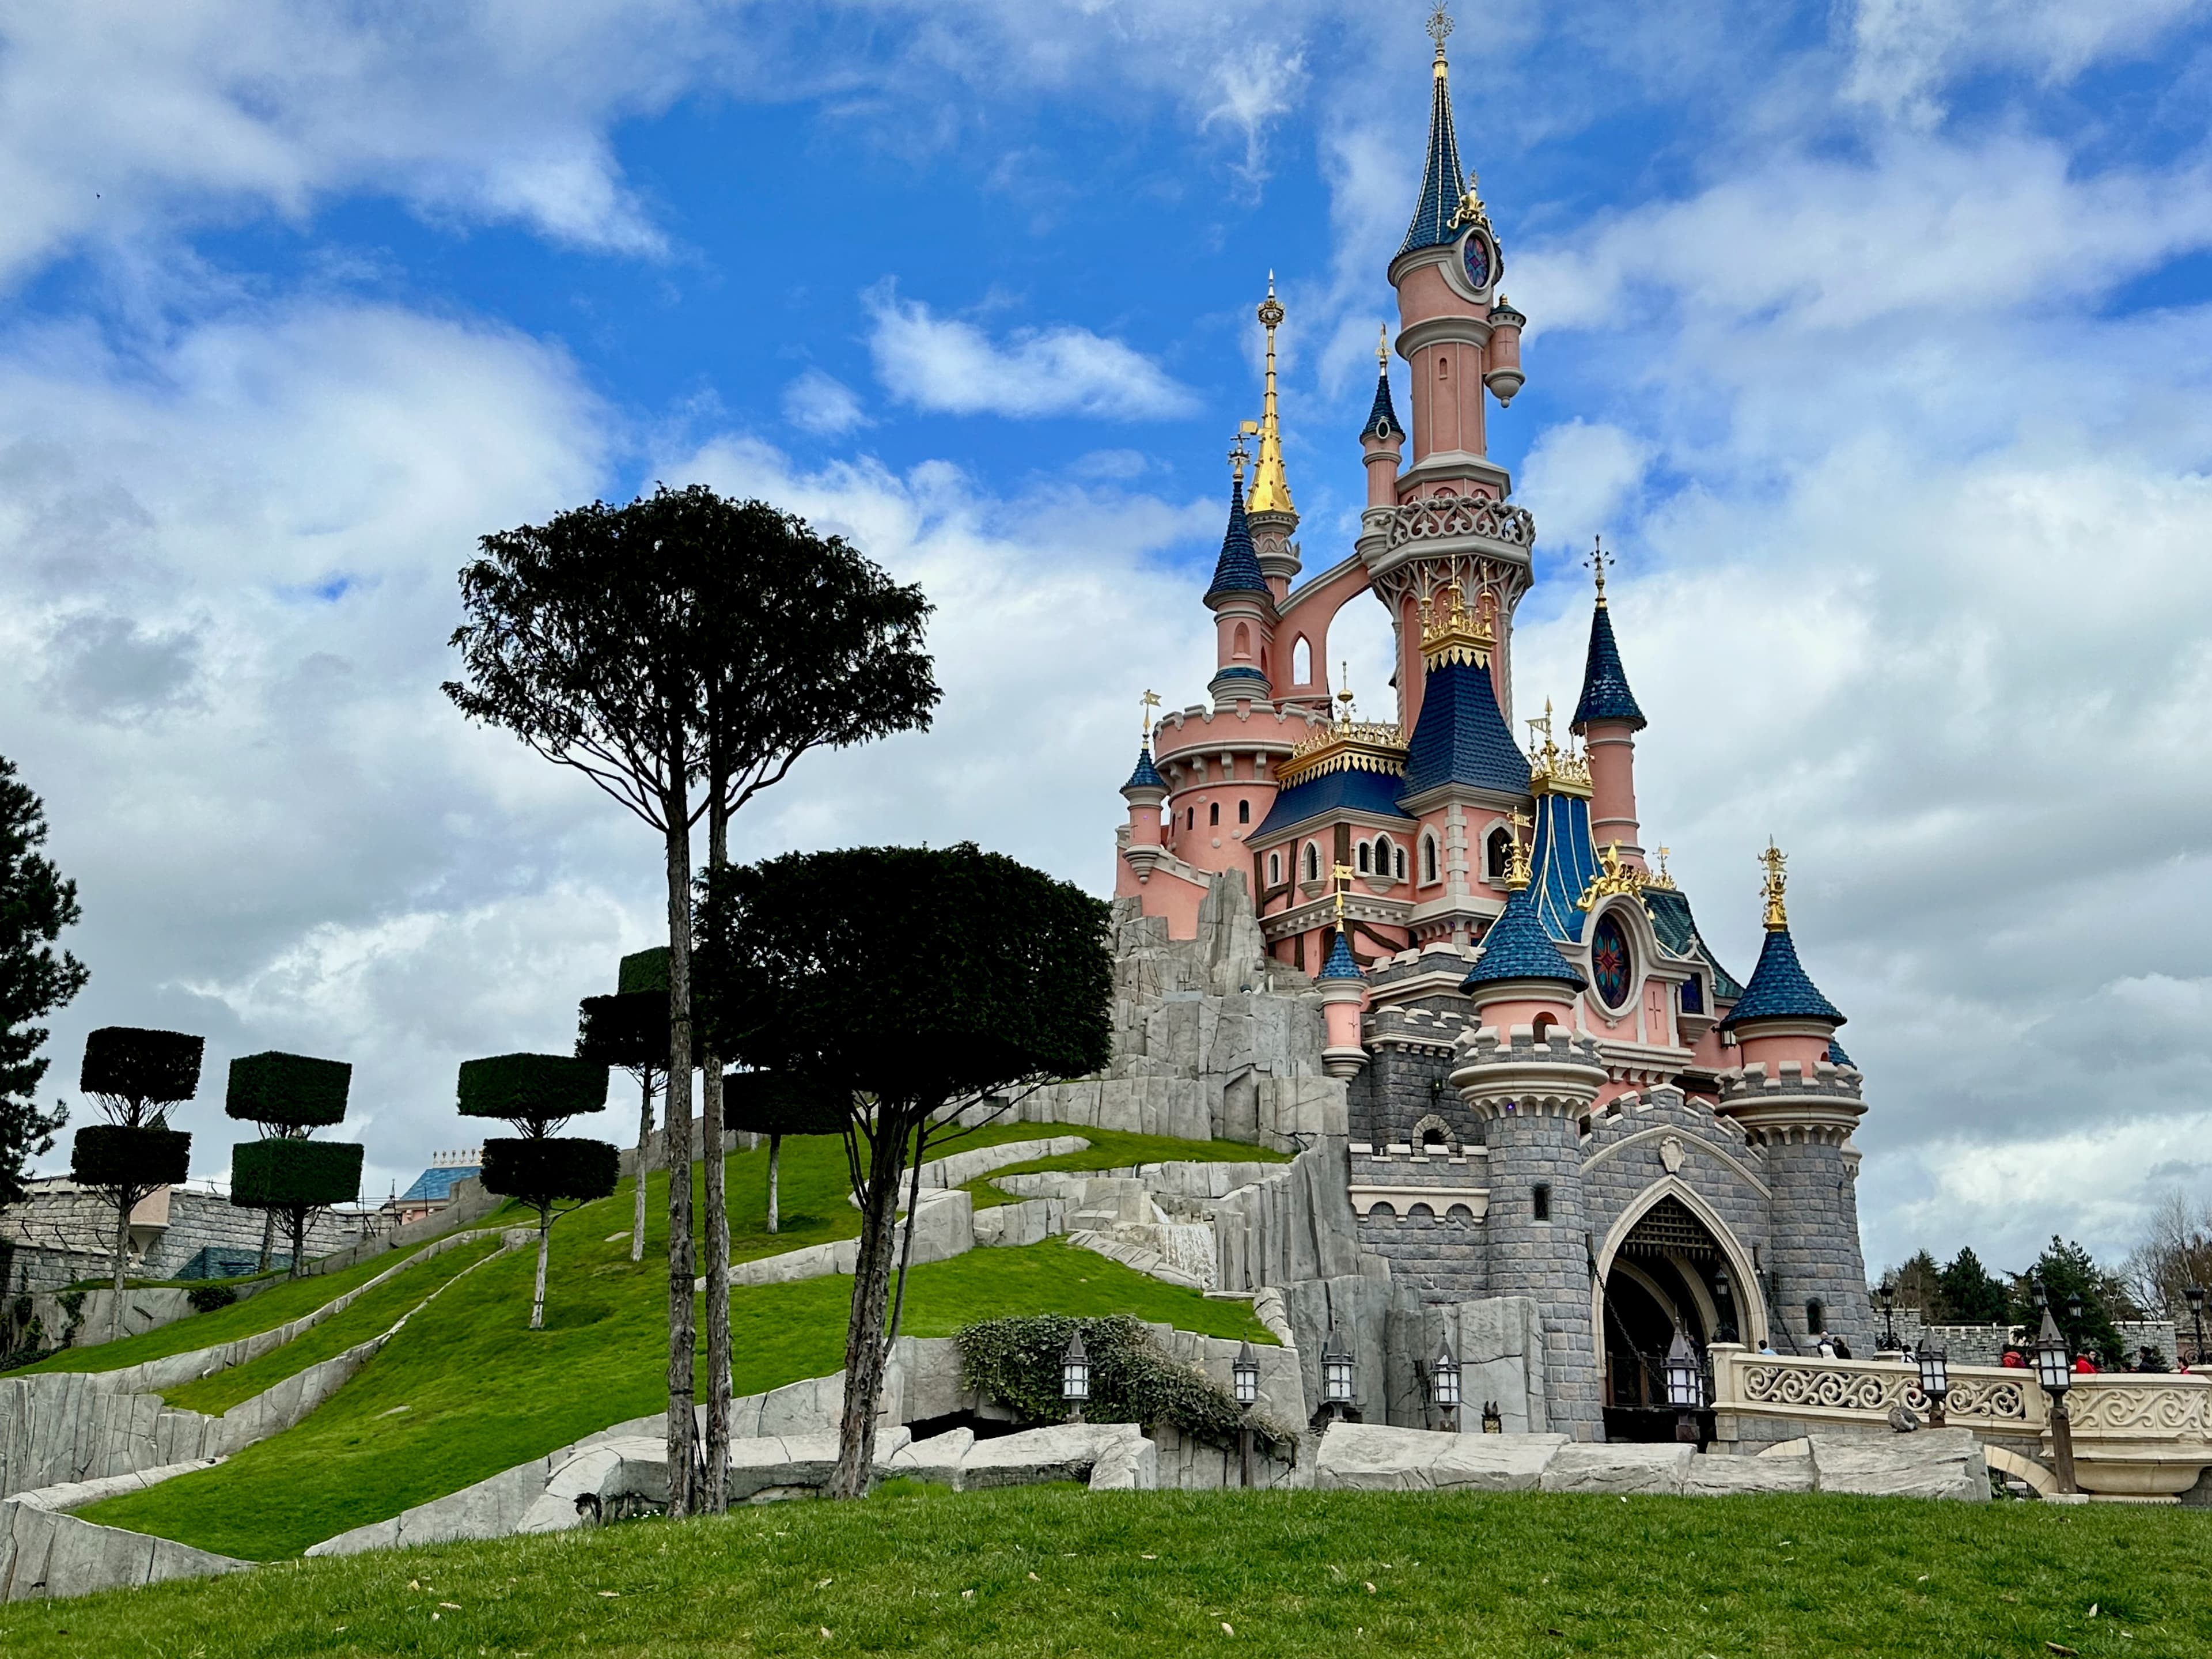
Magic Kingdom Park
Orlando, USA
park.fan · forecasting model
It reads millions of live wait times to predict how busy a park will be up to 365 days ahead — and grades itself, in the open.
Fancast is our in-house forecasting model — the part of park.fan that looks into the future. The name? Shameless but systematic: fan as in park.fan, cast as in forecast. A weather report for queues, basically.
And because we only trust numbers that have to prove themselves, Fancast does something most models quietly avoid: it grades itself. Every prediction is later checked against the wait time that actually happened — in the open, on this page. Cheating pointless.
In short: Fancast is not a fortune teller with a crystal ball. It is a stubborn statistician that gets tutoring every night and has to re-sit the exam every morning. A weather frog that fact-checks its own weather.
Enough preamble — here is the grade, live and unvarnished. Fancast pulls these numbers from its own dashboard right now; they shift the moment the model retrains tonight.
park.fan uses its own AI model trained on millions of real queue records to forecast crowd levels and wait times at theme parks worldwide. The model factors in weather forecasts, school holiday calendars, and known events — and retrains automatically as fresh data arrives.
Every wait time forecast is built from three layers of data: historical queue records collected from parks over years, external signals like weather forecasts and school holiday calendars, and contextual factors such as special events and seasonal patterns. The model generates both hourly wait time forecasts for individual rides and daily crowd level ratings for full park visits — available up to 365 days ahead.
park.fan is a living platform, still in active development. Every day the system automatically compares its earlier predictions against the wait times actually recorded at the parks, feeding those comparisons back into the next training cycle. The accuracy metrics above reflect this real-world performance — not synthetic benchmarks. New parks and attractions are added regularly, and the model becomes more accurate as it accumulates more verified data for each destination.
The rides whose recent forecasts landed closest to the real wait — average error in minutes, live from the model.
| Ride | Park | Avg error |
|---|---|---|
| Bumper CarEverland | ±2.4 min | |
| Shooting GhostEverland | ±2.4 min | |
| Bow Wow BlasterSchlitterbahn NB | ±2.4 min | |
| JukeBoxLiseberg | ±2.8 min | |
| HurricaneEverland | ±3.2 min |
A rainy bridge-day in October is a completely different animal from a sunny holiday Saturday in July — and a model has to learn that first. So Fancast feeds on several sources at once:
Millions of real readings from 150+ parks, updated by the minute. The raw currency of every forecast.
Weekends, public holidays and school breaks — including neighbouring regions, because day-trippers do not care about borders.
Rain probability and temperature bend the near-term forecasts. Sun pulls crowds in, all-day rain empties the paths.
Halloween, summer holidays, long weekends, a headliner in its first summer — the usual suspects for a packed day.
Years of wait-time history per park. Patterns you only see if you stare at them long enough.
When the park opens, for how long, at what capacity — the frame everything else fits into.
Out of this mix the model makes two things: an hourly wait-time forecast for individual rides and a daily crowd-level grade for the whole park.
All theory is grey — Fancast only gets tangible at an actual park. Three examples of how the same ingredients turn into three completely different forecasts:
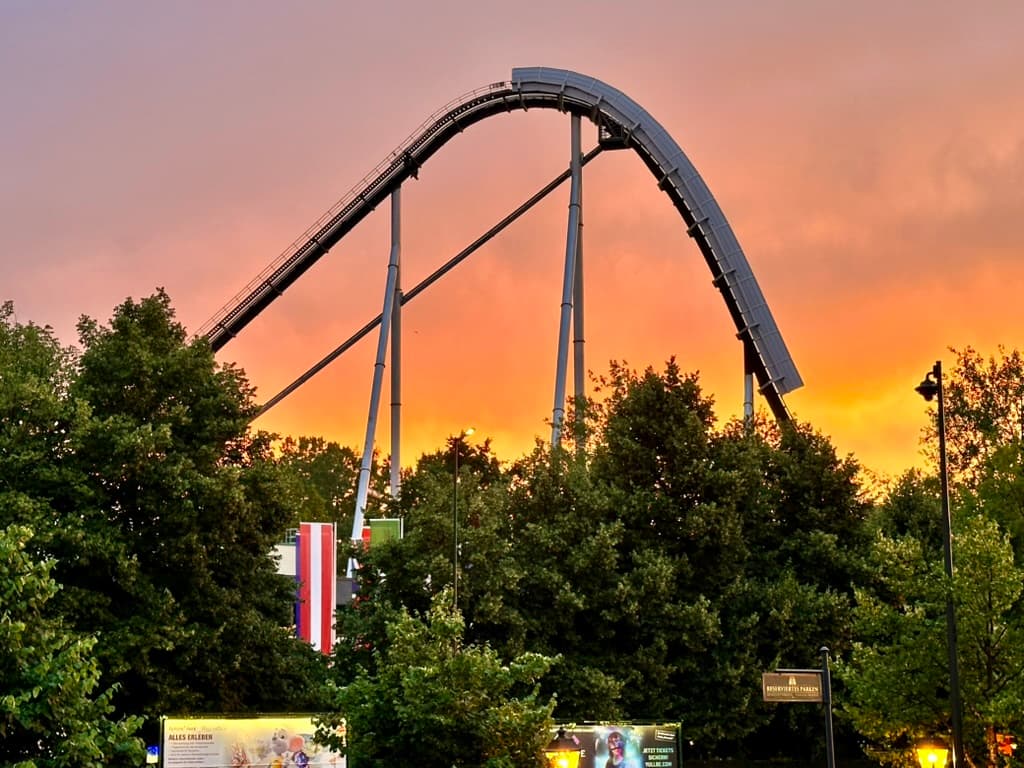
Fancast sees: school holidays in only one neighbouring region, mixed weather, no special event. Result: a calm, green forecast — Voltron Nevera probably under 30 minutes, blue fire a walk-on. The same park three weeks later on a holiday Saturday? Deep red. Six million yearly guests do not spread themselves out on their own.
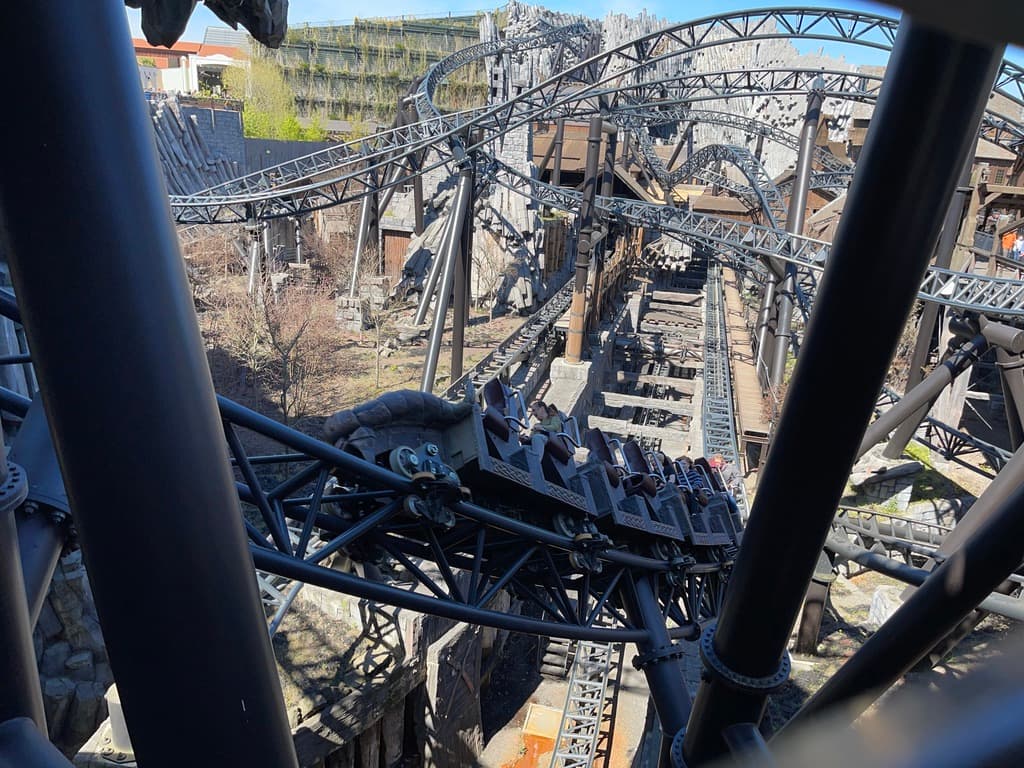
Compact park, few headliners, everyone wants Taron — saturation arrives faster than the first beer is poured. Fancast knows this and paints the day orange to red. The calendar next to it promptly suggests the Tuesday after, when you can ride Taron back-to-back instead of just longing for it.
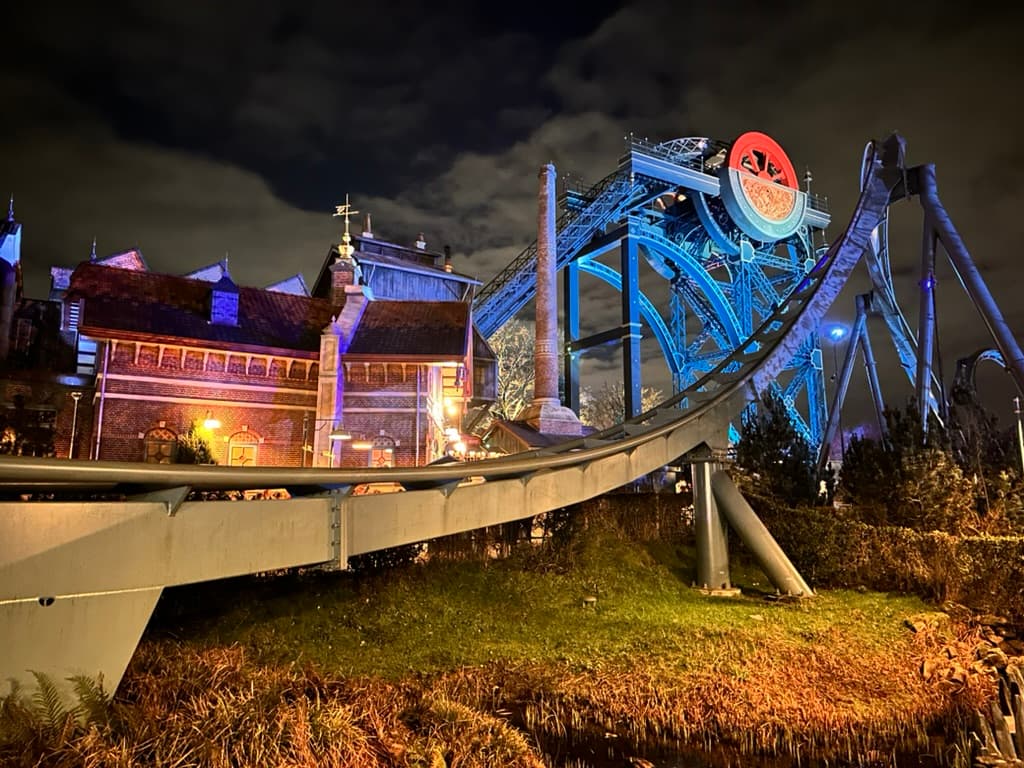
Exactly the day gut-feeling planners avoid — and that Fancast paints green. Few holidays, miserable weather, short queues. It works precisely until everyone has read the same insider tip; which is why the model folds the rain probability in itself, instead of relying on folklore.
The most important trick is an unglamorous one: Fancast retrains every night, every day at 06:00 UTC. Whatever happened yesterday, the model knows today. A coaster fan gets older and more tired over the years — Fancast gets a little smarter every morning.
And it is only ever tested on days it has never seen — on the future, not on memorised days from the past. Anything else would be like slipping yourself the exam questions in advance and then celebrating your straight-A report card.
On top of that, Fancast watches whether it is drifting — whether reality is slowly running away from it. And a new model version only goes live if it genuinely beats the old one in a fair head-to-head. Democracy among algorithms: if you are not better, you stay on the bench.
At the end of all that arithmetic sits a single colour. Six levels, from “you have basically got the park to yourself” to “welcome to a holiday Saturday”:
Almost empty. Rope-drop dreams, back-to-back rides, a photo with the mascot and no queue.
Relaxed. Short waits, you get on everything without needing a battle plan.
Normal operation. The headliners fill up, the rest stays easy-going. A solid compromise day.
Noticeably busy. For the top rides it pays to get up early — or to bring patience.
Properly busy. Long queues at the highlights; planning clearly beats spontaneity.
Full alert. Holiday Saturday in high summer. Only with a strategy, stamina and a sense of humour.
Enough theory. Fancast runs on every park page — here are a few popular ones to try it on directly. Click in, open the crowd calendar, and see which colour your chosen day gets:
Fancast does not live on one lonely page — it is woven through all of park.fan, usually without introducing itself:
the crowd-level grade in the park header, before you even tap the first ride.
the calendar of best days to visit on every park page — green, yellow, red, up to a year ahead.
the quietest weekdays and the upcoming insider days, distilled from the same data.
the dashed line that reveals a ride’s cheapest time windows.
the honest answer to “is it worth arriving early?” — including the expected troughs.
honest over guessed: parks with too little data get No forecast instead of an invented number.
How it all plays out inside a park is walked through step by step in the full guide — crowd calendar, badges and live wait times included.
The current accuracy is shown live in the scorecard above — as MAE (average error in minutes), RMSE and MAPE. Those figures come from actually comparing past predictions with the wait times that were really measured, not from a flattering test lab. They change whenever the model retrains.
Fancast gives daily crowd levels for a park up to 365 days ahead. For individual rides it also produces hourly wait-time forecasts. The closer the day gets, the more short-term signals like the weather forecast are factored in.
From the interplay of many signals: school and public holiday calendars (including neighbouring regions), the day of week, the weather forecast, special events and the park’s full wait-time history. A holiday Saturday in high summer carries almost all of those factors at once — which is why the forecast spikes there, while a rainy Tuesday in November stays green.
Every day. Fancast automatically retrains once a day at 06:00 UTC on the freshest data — including yesterday’s wait times. So it literally gets a little better every morning.
Yes. Every park page on park.fan has a crowd calendar that shows you a green, yellow or red forecast for each individual day up to a year ahead — from Europa-Park to Phantasialand, Efteling and Walt Disney World. You also get hourly wait-time forecasts for the individual rides.
Live and historical wait times from over 150 parks, school and public holiday calendars (including neighbouring regions), weather forecasts, opening hours, special events and seasonal patterns. That mix produces the daily crowd levels and the hourly wait-time forecasts.
Fancast only rates a park once there is enough operating data — at least around 30 operating days. Brand-new or rarely-open parks do not have that basis yet, so we would rather honestly show “No forecast” than a guessed number.
No. Like all of park.fan, every forecast, crowd calendar and statistic is free, ad-free and usable without an account.